Steal Our Manufacturing daily production report Template
- September 13, 2024
Category : Production monitoring systems
- Steal Our Manufacturing daily production report Template

Dasarathi G V
Director in Leanworx
Dasarathi has extensive experience in CNC programming, tooling, and managing shop floors. His expertise extends to the architecture, testing, and support of CAD/CAM, DNC, and Industry 4.0 systems.
Try Leanworx for free
Manufacturing daily production report
In any manufacturing organization, decision makers at various levels, from cell supervisors to plant managers, need manufacturing production reports to run the shop floor efficiently. The reports give them information like this :
- What part is running on each machine?
- Who is the operator is on each machine.
- The current production quantity and what is the planned quantity.
- The status of each machine – running, idle, under breakdown, etc.
- The rejection percentage.
What you’ll Learn :
What is Production Reporting?
Production reporting is the providing of production and productivity (production efficiency) data to decision makers 24/7, wherever they are, on convenient devices. Key data for each machine would be:
– Part name and part number running.
– Operator running the machine.
– Current vs. Planned production quantity
– Overall Equipment Effectiveness (OEE), Availability, Performance, Quality.
– Downtime durations and reasons, for each downtime incidence.
– Rejection quality and reason.
Manufacturing reports
Manufacturing reports show the production and productivity data in a form that can be easily understood by shop floor personnel. Typically as tables, trend graphs, Pareto charts, Pie charts, etc.
Real Time Production Reporting
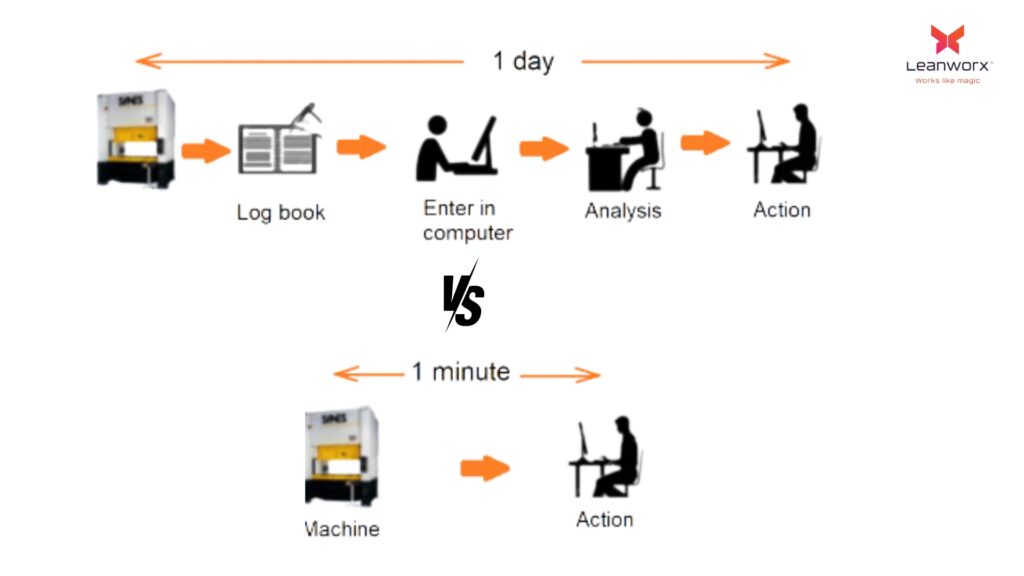
Traditionally, production reporting depends on data collection from machines by people, noted down on paper. The data goes through a chain of humans till it is converted to a form given to decision makers.
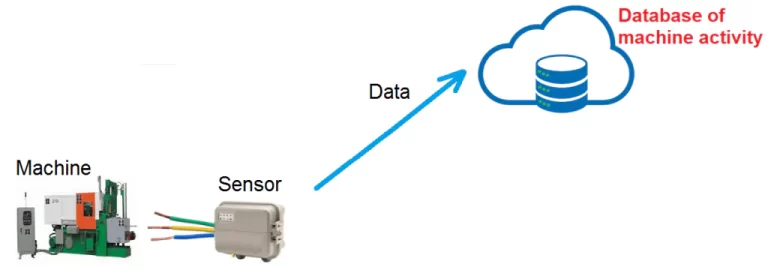
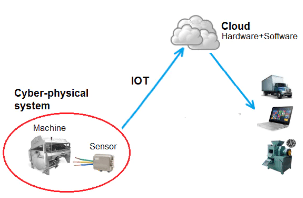
In real-time production reporting, data is tracked automatically from machines and available to decision makers within seconds.
There are a variety of reports available: hourly production, shift-wise and day-wise production, details of individual cycle times, planned vs. Actual production, production quantity trends, downtime details and analysis, rejection details and analysis, etc.
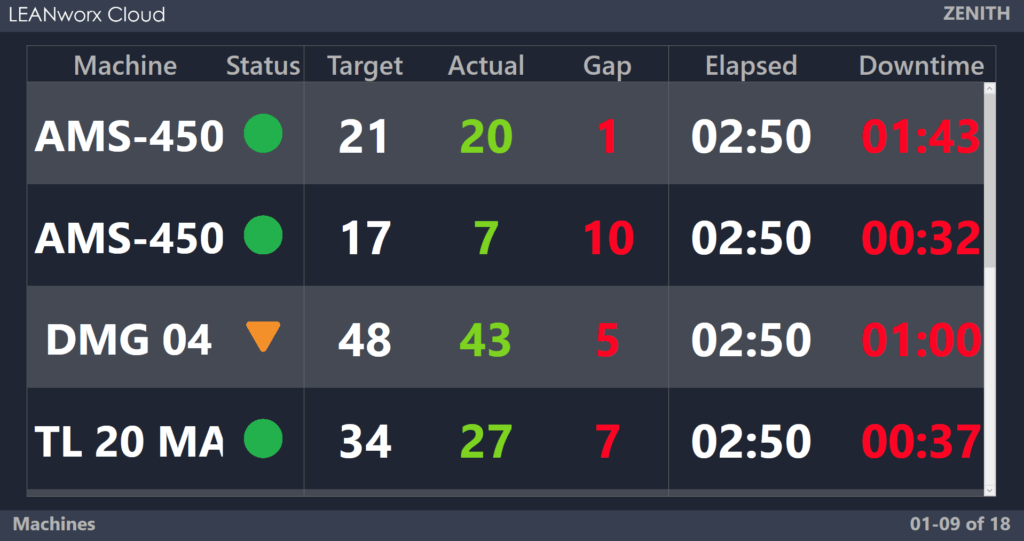
There are real-time dashboards and Andon boards that show the current status on each machine, updated every few seconds. There are historical reports that show past data (previous shifts, previous days, weeks, months, quarters, etc.).
Production supervisors and managers get an alert on their mobile phone or email when there is a situation that requires immediate attention: target shortfall, abnormal machine downtime, machine breakdown, etc.
Benefits of Real Time Manufacturing Reports
Example of benefit of production tracking by machine monitoring system: Leanworx is connected to 45 machines in an automobile parts manufacturer’s plant.
The machines are mostly presses. Production cycles times vary from 3 seconds to 20 seconds, translating to 1300 to 9000 parts produced per shift on each machine. Before Leanworx was deployed, data collection was manual, via paper. Production numbers were inaccurate, resulting in: overproduction causing excess inventory and increase in inventory holding cost; under-production causing delivery delays; inability to make proper production schedules.
Leanworx counts the actual number of parts made, at any instant. A variety of reports show hourly and shift-wise production, downtimes and rejections. Parts are made to schedule, and overproduction and under-production have been eliminated, leading to lower inventory costs, better scheduling, and improvement in profitability.
Start using Leanworx for free
We provide a 5-day free demo, with assistance in installation and usage.
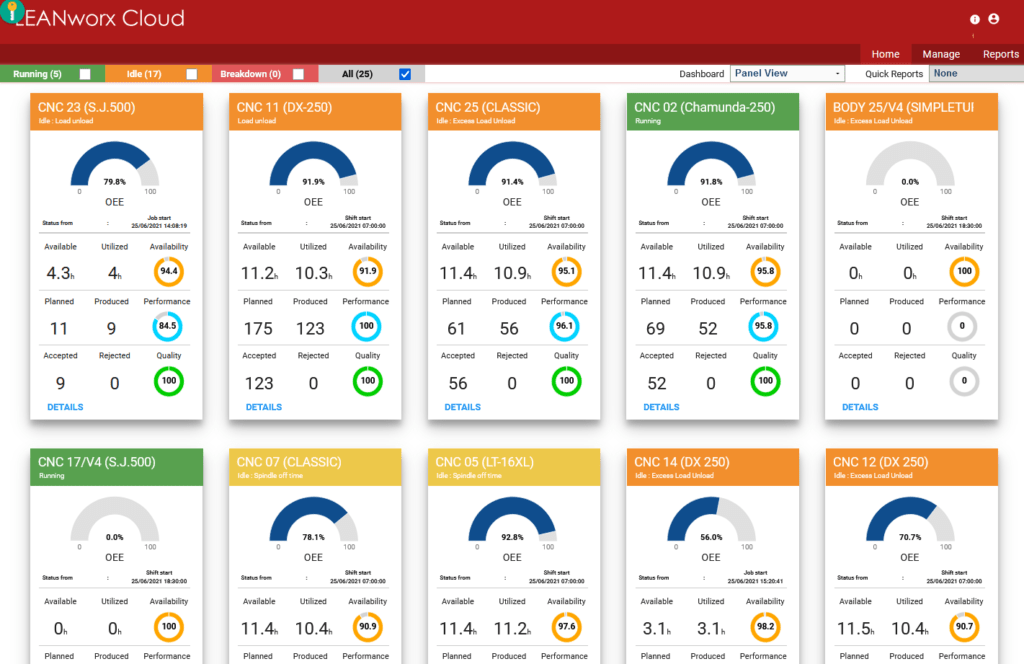
Daily production report manufacturing template
The purpose of a daily production report is to enable personnel at various levels in the shop floor to analyze the previous day’s production and productivity and:
1. Correct any over-production or under-production.
2. Analyze causes of problems – machine downtimes, production shortfalls, part rejections.
3. Change standard operating procedures and working systems to ensure that problems do not occur again.
People across departments and all levels of hierarchy must understand the daily report. It must be easy to understand, and encapsulate all the required data. A Daily production report manufacturing template ensures this.
This is the top level report that people look at as the starting point. Any problems noticed here must then be analyzed in greater detail by drilling down into other detailed reports.
Detailed production and productivity reports
Here are some of the important detailed reports for analysing and eliminating causes of poor productivity
The OEE report shows OEE, Availability , Performance, Quality for a machine. The OEE comparison report shows comparison between machines, so you can identify and focus on the poor performing machines. OEE trend reports show long term trends of OEE to study how your OEE improvement efforts are yielding fruit.
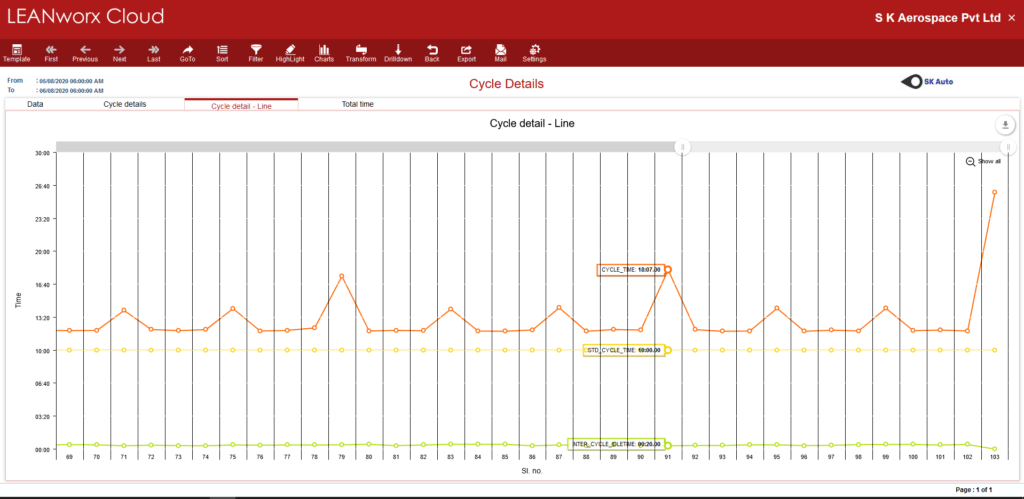
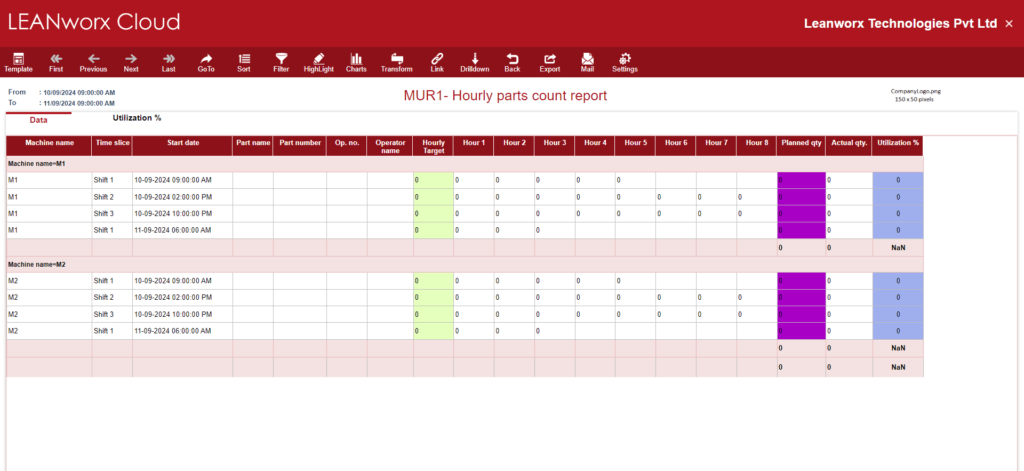
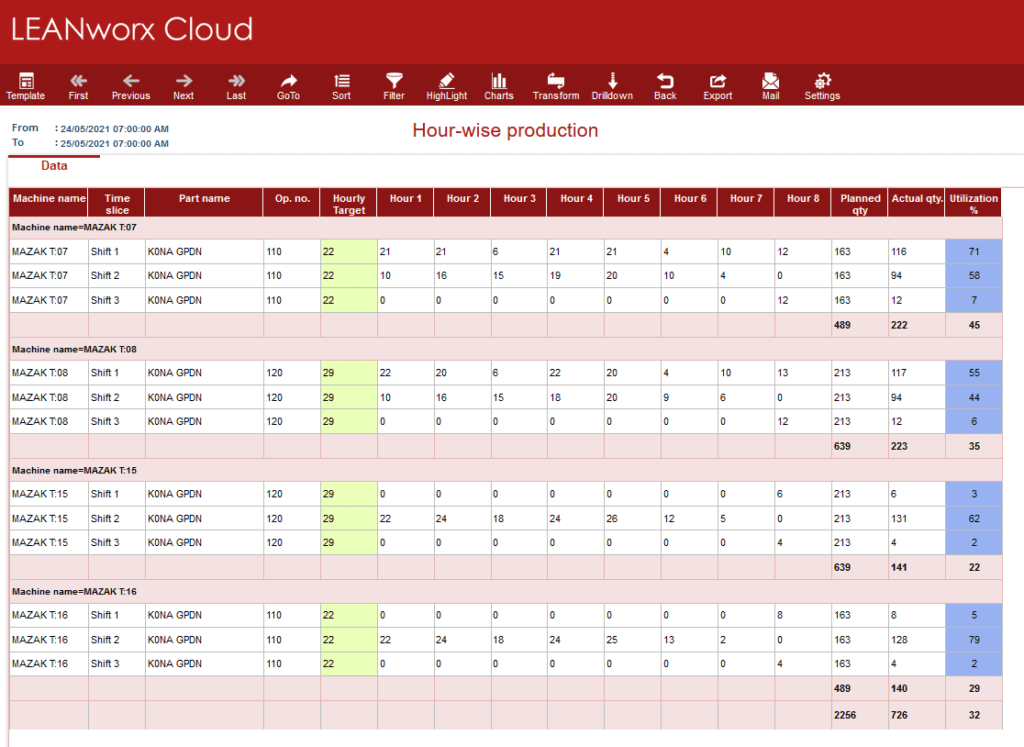
The hourly production report shows you the target hourly production and the actual production every hour of a shift. The cycle details report shows you details of every manufacturing cycle – actual vs standard cycle time, actual vs standard load-unload time, time at which each cycle occurred, etc.
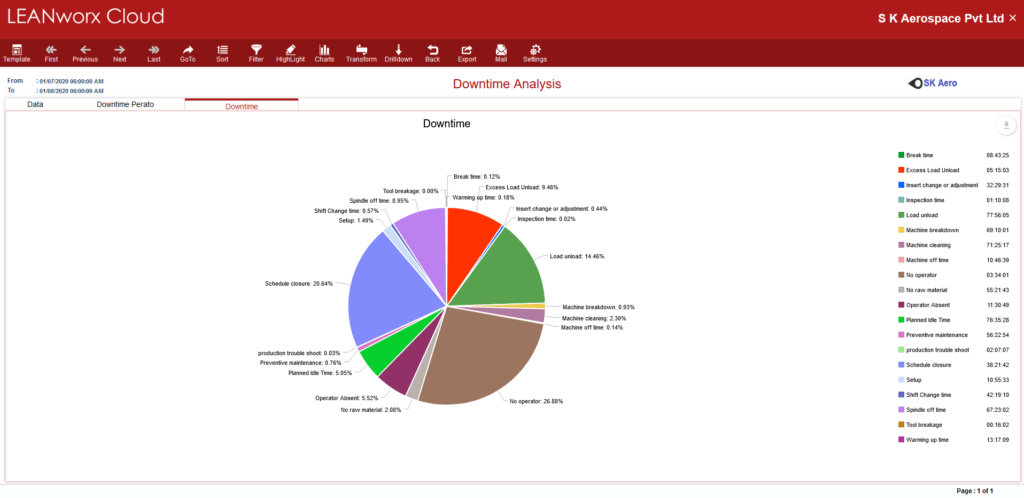
The downtime analysis report shows the causes of various downtimes as a Pie or Pareto chart. It highlights the key causes of downtime so you can focus on them first. The big downtimes report shows abnormally long downtime durations and their causes. The downtime details report shows every single downtime incidence. The downtime trend report shows you the trend of downtime duration and downtime % over longer periods – weekly, monthly, yearly, etc.
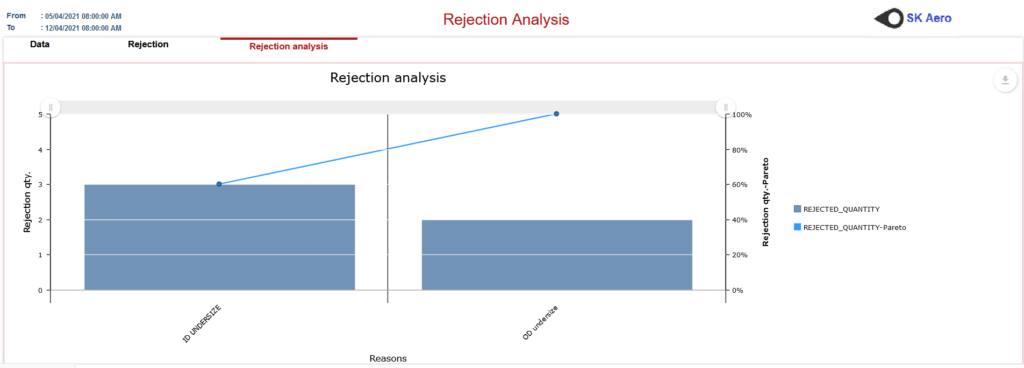
Rejection analysis reports highlight the top reasons for rejection as pareto or Pie charts. The rejection details report lists each instance of a rejection – the cause, time, machine, operator, etc. Rejection trends reports show you long time trends week-wise, month-wise, quarter-wise, year-wise. Inspection data reports show values inspected parameters with time of inspection, machine, operator, etc.
The consumables consumption analysis report shows the consumption of energy, cutting tools, welding wire, furnace gasses, coolant, etc. It highlights the big consumption items through a Pareto chart or Pie chart, so you can focus on them and reduce their quantity. There is a consumption incidence report that shows each item consumed, the time, machine, operator, etc. You can see the long term trend of consumption of any selected consumable.
There are revenue reports showing revenue loss due to downtime, revenue loss due to rejections.
Maintenance reports show breakdown incidences, and maintenance KPIs like MTTA, MTBF, MTTR. You can use these to reduce breakdowns, check the effectiveness of your improved preventive maintenance system, and reduce downtime due to machine issues.
Operator efficiency reports show the operation efficiency of operators. You can study these and determine gaps in skill, target individual operators with specific training programs to improve their skill levels.
Keep Learning
Increase your profits automatically. Use Leanworx to get accurate and instant data 24/7.