Best manufacturing data collection software for shop floors
- August 14, 2024
Category : Production monitoring systems
- Best manufacturing data collection software for shop floors

Dasarathi G V
Director in Leanworx
Dasarathi has extensive experience in CNC programming, tooling, and managing shop floors. His expertise extends to the architecture, testing, and support of CAD/CAM, DNC, and Industry 4.0 systems.
Try Leanworx for free
Manufacturing data collection software
- Collect data automatically from machines on production quantity, downtime durations, etc.
- Collect other data from operators on downtime reasons, rejections, etc.
- Store the data in a central location.
- Analyze the data, show lower level decision makers current data for immediate action.
- Show higher level decision makers historical data to analyze trends and take long term action to improve processes and systems.
What you’ll Learn :
Data collection in manufacturing
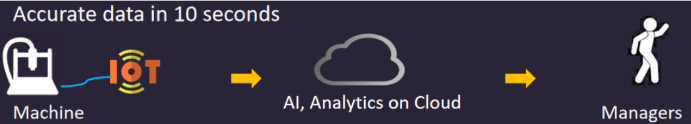
This is how data collection in manufacturing works, on an Industry 4.0 based system.
There is a sensor on each machine that collects data from it. The sensor detects various machine activities like the start of a part cycle, idle duration, etc. The sensor sends the data to a cloud server over the internet, via a mobile phone network or the company’s broadband internet. Software on the cloud server collects the data and stores it in a large database. Whenever required by users or any other software, the software analyzes the data and displays it to people, sends it to other software, sends it back to machines, etc.
The data is collected, analyzed immediately by software, and available to human users or other software within seconds. With production monitoring via an Industry 4.0 based machine monitoring system, data flow is instantaneous, accurate, 24/7.
Manufacturing data collection and analysis
There is a variety of data that decision makers at all levels in a shop floor (supervisors to CEO) need to run a shop floor efficiently. Some of the data needs to be seen in real-time (as it happens), and some of it needs to be seen as historical trends. Here are some of.
You can see a variety of online dashboards and reports with a shop floor data collection software that is part of a real time shop floor data collection system. You can get reports and alerts on production quantity, planned quantity, productivity (OEE, Availability, Performance, Quality), downtime durations and reasons, energy consumption, consumables usage quantity, machine breakdown, part rejection quantity and rejection reasons, operator efficiency, etc. Here is a brief explanation on each of these.
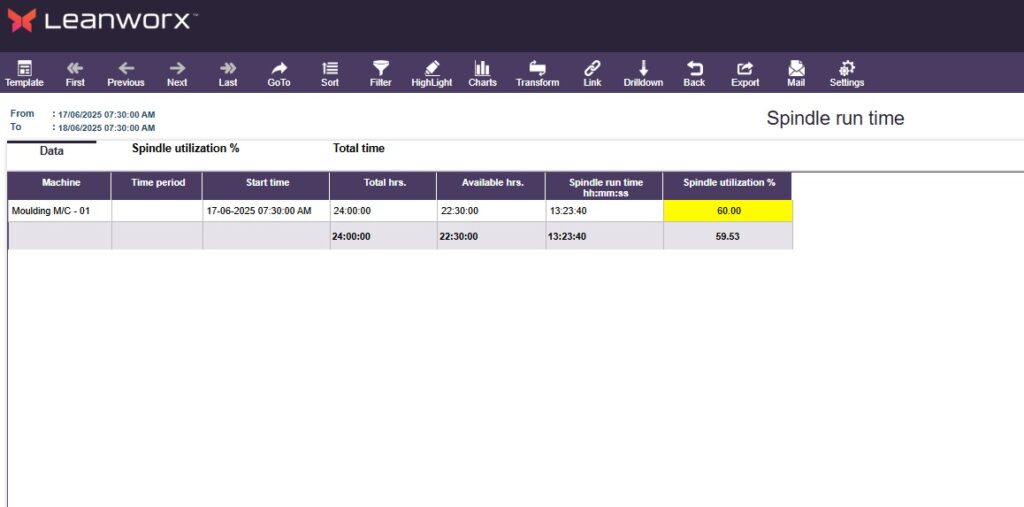
OEE analysis and reporting
OEE is measure of the capacity utilization of your machines, used universally across the world. It is a single number that shows you how efficiently you are using your equipment: how many good parts they have produced versus how many they could have produced. The higher the OEE, the better your capacity utilization. OEE is improved by reducing waste on machines, primarily machine downtime and material waste in he form of part rejections. Much of manufacturing data collection and analysis finally focuses on improving the OEE. It is shown to decision makers in a variety of ways:
- Long term trends of OEE, Availability, Performance and Quality: month-wise, quarter-wise, year-wise, etc.
- Short term trends of OEE, A, P, Q shift-wise, day-wise, week-wise.
- OEE comparison between machines and collections of machines – cell, line, shop, plant.
- OEE, production, downtime, etc from the beginning of the current shift.
- Large screen displays on the shop floor called Andon boards, showing the current shift’s OEE, production, downtime.
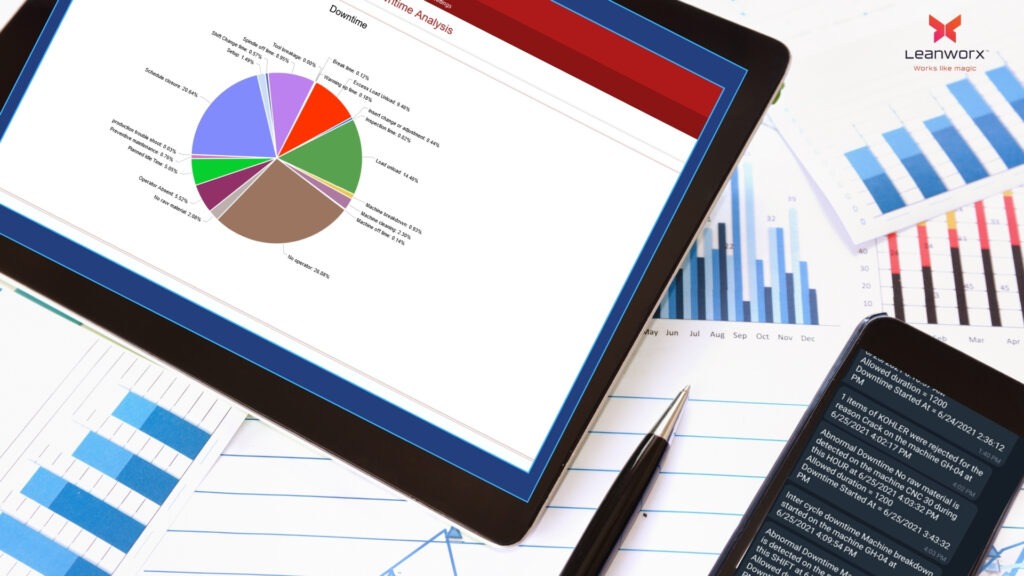
Downtime durations and reasons
Data collection and analysis of downtimes is critical to improving productivity. Machine downtime durations and their reasons are analyzed and displayed in a variety of ways based on who is looking at the data. Downtime in dashboards and Andon boards show current shift data, Reports show details of each machine downtime incidence with duration and reason, downtime analysis reports downtimes at shift change, other analysis reports show key downtime reasons and their cumulative durations. Long term downtime trends show the trends over months, quarters or years.
Production quantity - planned versus actual
Production reports show the production quantity in each hour, in each shift, daily. You can also see comparison between actual and planned production, details of individual production cycles, and trends of production quantity. Production can be seen for each work order. Current production quantity, target quantity, and shortfall are displayed on dashboards and Andon boards.
Energy consumption tracking
You can see reports of machine-wise and part-wise energy consumption, hourly, daily, weekly, etc. Long term trends of consumption enable you to study the impact of your efforts on reduction of energy consumption.
You can track both these:
1. Electrical energy consumption of individual machines.
2. Fuel consumption in furnaces and gensets.
The data enables you to do these:
– Switch of machines that are idle for extended periods of time.
– Take advantage of variable time-of-day energy tariffs (‘happy hours’).
– Weed out or improve high energy consuming machines.
Quality analysis and reporting
You can get reports of rejections and part dimensions. You get reports of each rejection incidence (quantity, reason, date and time, etc.), and reports of dimension data for each inspection incidence. You can analyses of rejections like the top reasons, machines on which there is maximum rejection, etc. Long term rejection trends enable you to focus on long term measures.
Start using Leanworx for free
We provide a 5-day free demo, with assistance in installation and usage.
Data collection, and rapid action
Data that is collected and displayed will often need immediate action. You cannot be constantly on alert and looking at live data as it is streaming in – this is physically and mentally impossible to do. To enable you to take instant action when something is going wrong, the data collection software has an alerting feature that informs the appropriate people when something wrong on the shop floor. Examples: machine breakdown, abnormal downtime, production quantity below target, abnormal rejections, operator absent, etc.
Based on the nature of the problem, alerts go to different decision makers on their mobile phone or email. E.g., Production supervisors and managers when there is a production shortfall, maintenance personnel when there is a machine breakdown, etc.
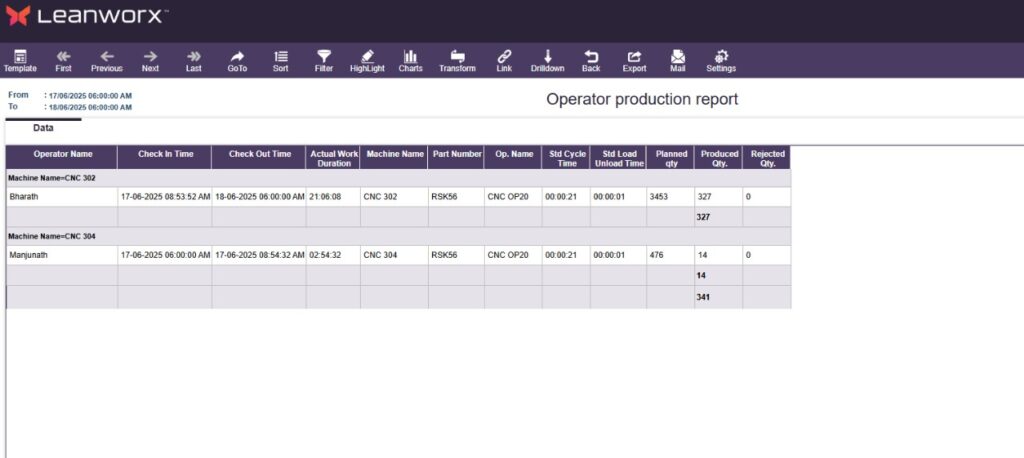
Operator performance analysis and reporting
Most machines are operated by people, and the productivity of the machine depends on its operator. The machine data collection and analysis software tracks and reports the performance of individual operators, and is typically capable of doing these:
– Match the operator’s skill level with the type of machine
– Report consumables consumption and rejections
– Report productvity KPIs
You can use these reports to improve HR :
– Pin-point training issues and customize training to improve skills.
– Incentivize operators based on individual performance.
Consumables monitoring - continuous and discrete consumables
Consumables consumption can be tracked and reported to reduce their cost, and to make purchase decisions between vendors. Reports like this are available with analysis of raw data:
- Details of consumable change incidences: Name of consumable, when it was changed, who changed it, what was the duration between successive changes, etc.
- Usage analysis that shows the relative consumption between different consumables as Pareto and pie charts. This can help you identify high cost and volume consumables and reduce their usage.
Maintenance monitoring
Systematic preventive maintenance can dramatically cut down the number of machine breakdowns. Rapid response and repair during breakdowns can reduce machine downtime. The manufacturing data collection software has a variety of features for scheduling, tracking, alerting and reporting for various types of maintenance:
- Breakdown maintenance (UM): Ticket creation, opening, closing, acceptance.
- Time based preventive maintenance (TBM): automatic ticket creation, alerting, scheduling.
- Usage based preventive maintenance (UBM): automatic ticket creation, alerting
- Condition based maintenance (CBM): automatic ticket creation, alerting
- Tracking of Mean time to attend (MTTA), Mean time to repair (MTTR), Mean time between failures (MTBF)
Shop floor data collection - types of data
Shop floor data collection from individual machines and other equipment must provide the raw material for the manufacturing data analysis done by the software. Some of this data comes from machines, some from operators, and some from other equipment like manual or automatic inspection equipment. The raw data would typically be:
– Production count, cycle times, load and unload times
– Downtime durations, reasons for downtime
– Rejection quantity, rejection reason
– Dimension data for critical dimensions inspected at machines or inspection stations.
– Energy consumption
– Consumption of consumables like tools, inserts, coolant, hydraulic oil, etc.
The data collection software and related hardware must be capable of collecting all this data from machines.
Keep Learning
Increase your profits automatically. Use Leanworx to get accurate and instant data 24/7.