Rejection Analysis in Manufacturing: All You Need to Know
- June 19, 2025
Category : Customer Problems

Dasarathi G V
Director in Leanworx
Dasarathi has extensive experience in CNC programming, tooling, and managing shop floors. His expertise extends to the architecture, testing, and support of CAD/CAM, DNC, and Industry 4.0 systems.
Try Leanworx for free
Rejection Analysis in Manufacturing for Lean Output
India is not immune to the growing global concern over rejection rates in manufacturing. In fact, rejection rate analysis in manufacturing has become a core focus for Indian industries to enhance quality, reduce waste, and remain globally competitive.
Based on research, rejection rates for Indian SMEs range between 3% and 15%, depending on industry and process expertise. The American Society for Quality (ASQ) estimates that the cost of poor quality (COPQ) in aerospace manufacturing ranges between 5 and 30% of total global sales. A review by IISE (Institute of Industrial and Systems Engineers) indicates that for manufacturing firms, COPQ generally ranges from 5% to 35% of sales, averaging around 15%. We have endless reports and studies that suggest rejections and sub-standard quality costs manufacturers more than they assume. These numbers highlight the growing need for a complete quality-first strategy while also showing the hidden financial burden on manufacturers.
The rejection rate has a direct impact on customer confidence, cost structures, and shop floor efficiency. We must handle tooling performance, process stability, and operator skill in an integrated manner to reduce the rejection rate. Avoidable scrap and rework are usually caused by an equal amount of human errors, process inconsistencies, and tool wear. While modern digital technologies like machine monitoring softwares provide real-time information, conventional quality tools like Pareto analysis help to prioritise the root issues. By combining these technologies, manufacturers may go from reactive inspection to predictive quality control, resolving rejects at the source while building a more robust and cost-effective manufacturing system.
Start using Leanworx for free
We provide a 5-day free demo, with assistance in installation and usage.
Reducing Scrap with Rejection Analysis in Manufacturing
Lowering rejection rates needs an in-depth awareness of the related aspects that give rise to part non-compliance. These are typically broken into three categories: operator-induced variation, process instability, and tooling-related issues.
Excessive or hidden tool wear is often the root cause of tooling-related problems, resulting in poor surface finishes and dimension inaccuracies. Even minor tool misalignments might cause dimensional errors or profile variations in high-precision machining. In addition, using the incorrect tooling, for example, selecting a generic cutter over one designed for a specific material, causes instability and accelerates tool failure, especially in demanding settings.
Differences in the method itself are equally important. Thermal distortion occurs in manufacturing settings, especially when performing heavy-load or continuous machining, and can cause tolerances to shift mid-cycle. Setup inconsistencies, such as poor fixture placement or referencing, reduce batch consistency. Also, using unstable machining parameters such as high feed rates or low spindle speeds typically results in vibration, chatter, and uneven material removal.
Operator-induced errors include skill-based gaps such as false offset entries, tool measurements, and inspection interpretations. Tiredness, frequent job changes, and a lack of standard operating procedures on the shop floor compound the issues.
- Predictive maintenance and tool life management should be used instead of replacements. This includes measuring cutting time, adding wear sensors, and making tool adjustments based on real-time performance rather than subjective limits.
- SPC and FMEA are two tools used in robust process design to identify, track, and control variation. When Cpk (Process Capability Index) and Ppk (Process Performance Index) readings are monitored, the process maintains constant capability while remaining within control limits.
- Human error can be greatly minimised by operator-focused interventions such as competency-based training, detailed SOPs, and practical retraining. Clear tolerance guidelines, GD&T quick references, and visual aids are all necessary for improving decision-making.
- Operators, managers, and engineers use multi-level checkpoints during Layered Process Audits (LPA) to ensure that critical process controls are followed. Audit results must have a direct impact on corrective measures, retraining, and design adjustments.
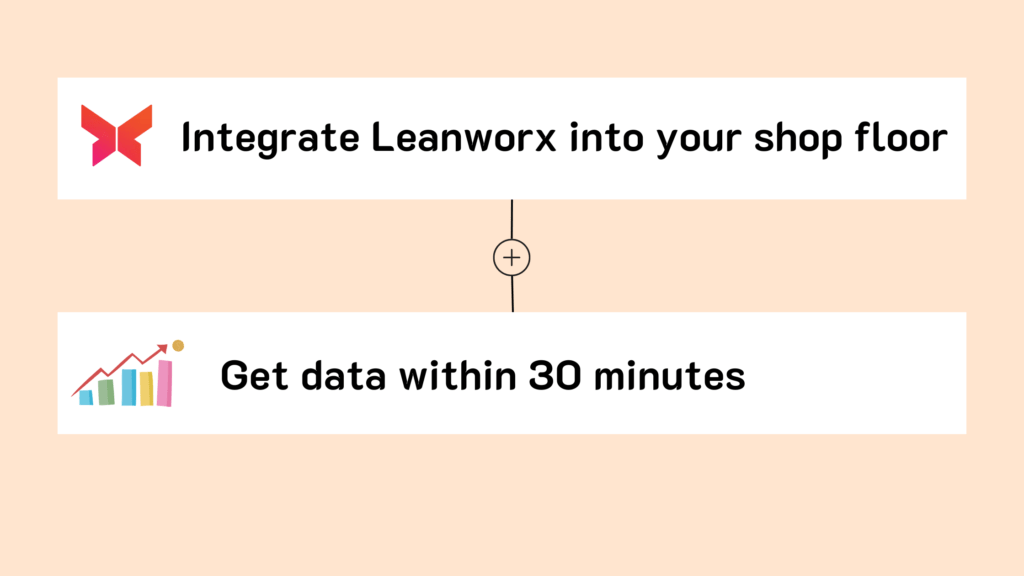
Reducing rejection rates begins with visibility, which entails knowing exactly where, when, and why faults arise. This requires real-time data collecting at the machine, part, and operator level. Systems like Leanworx, which monitor metrics such as cycle time variations, load fluctuations, and spindle behaviour, help in tracing errors down to specific shifts, operations, or setups. Alerts caused by defects or changes in feed rate, temperature, or tool wear allow corrective action to be done before rejections happen.
How can Pareto analysis be effectively used to minimize rejection rates
Pareto analysis is a powerful decision-making tool based on the 80/20 rule, which suggests that roughly 80% of problems are caused by just 20% of the underlying factors. In manufacturing, this method is used to statistically group and prioritize issues such as defects or rejection, so that teams can focus their efforts on the most impactful causes. By visually representing rejection data in a Pareto chart, manufacturers can quickly identify which types of defects or process errors are contributing to the overall rejection rates.
In a shop floor, Pareto analysis becomes extremely helpful when rejections are caused by specific reasons and grouped under structured categories such as:
- Tooling-related faults (e.g., worn inserts, tool breakage, misalignment)
- Process deviations (e.g., incorrect speeds/feeds, thermal distortion, unstable fixturing)
- Operator errors (e.g., incorrect offsets, manual handling damage, inspection oversights)
Manufacturers often use Pareto analysis to strategically reduce rejections by targeting the critical few issues that have the greatest effect on quality. For example, if most rejections are traced to tooling faults or specific operator errors, resources can be directed toward improving tool maintenance or providing targeted training. This focused approach ensures that corrective actions deliver the maximum benefit with minimal effort.
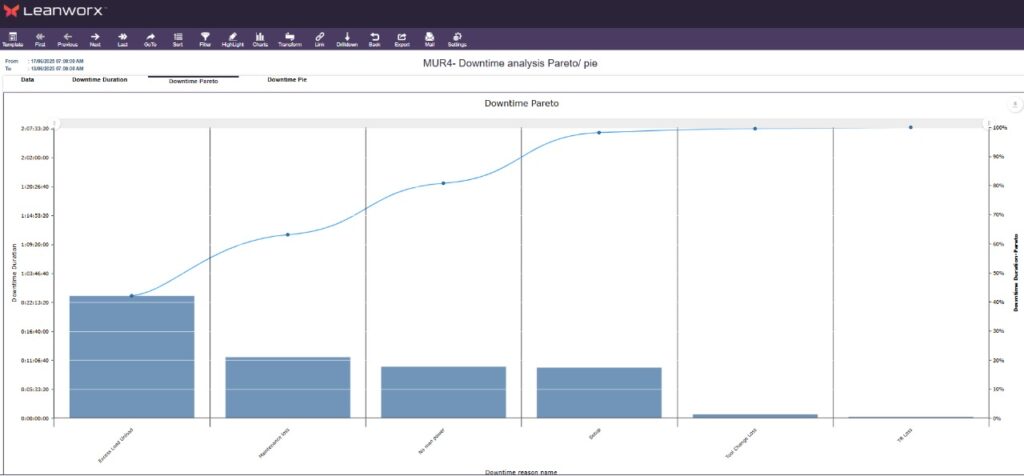
Traditionally, creating Pareto charts required manual data collection and analysis, which could be time-consuming and prone to errors. Instead, automated digital systems may now develop Pareto charts using data collected directly from the shop floor through audit records, inspection reports, and, increasingly through machine monitoring logs.
When paired with smart monitoring systems such as Leanworx, this process streamlines automatically by gathering rejection data from the shop floor and generating real-time Pareto charts. This automation not only saves time but also enhances accuracy, allowing manufacturers to instantly spot trends and address root cause improving overall production efficiency.
Increase your production efficiency now using Leanworx Try for free
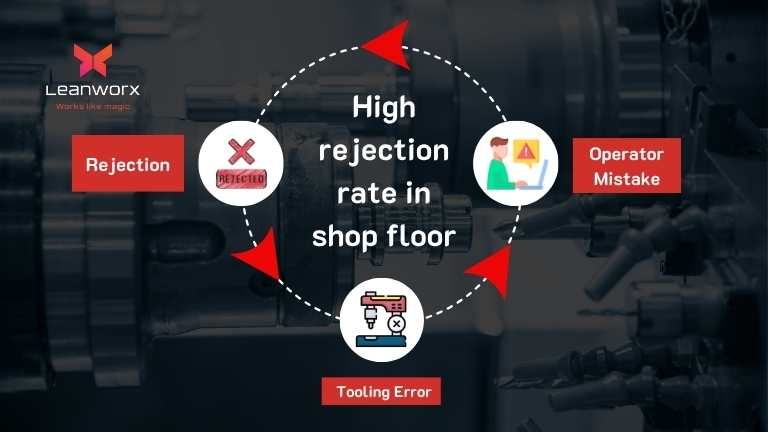
Tooling errors and operator mistakes can cause high rejection rate on shop floor
In an industry like auto parts manufacturing, sometimes parts don’t come out right and get rejected. This happens a lot due to tooling errors and operator mistakes. Tooling errors occur when tools become worn out, are the wrong type for the job, or machines are set up incorrectly. These issues can cause parts to be the wrong size, have poor surface quality, or break easily. Similarly, operator mistakes like incorrect machine setup, failure to follow procedures, or lack of proper training can also lead to defective parts.
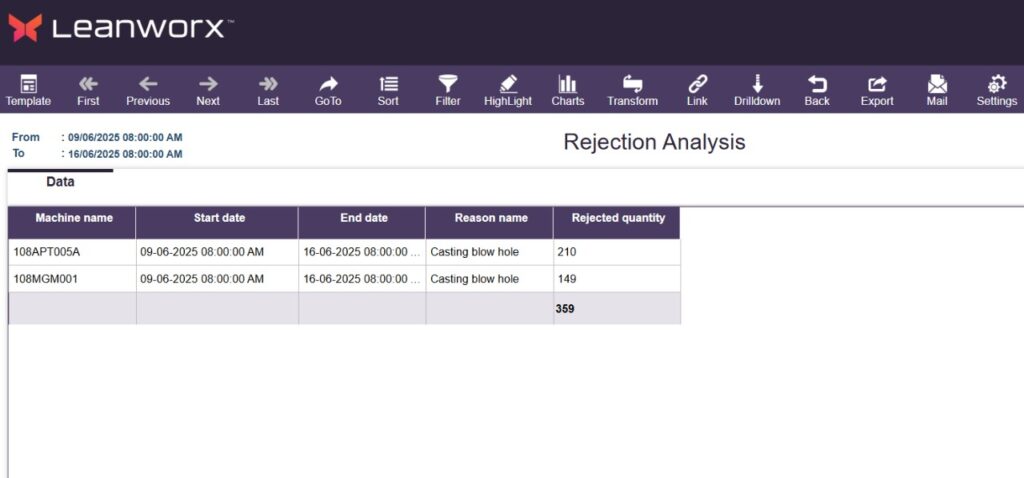
When parts are rejected, it means wasted materials, time, and money, which slows down production and reduces overall efficiency. Identifying the exact causes of these defects can be challenging without proper data, leading to guesswork and recurring problems on the shop floor. This is where advanced tools like Leanworx’s Rejection Analytics come in, helping manufacturers track, analyze, and understand rejection patterns with precision.
By providing detailed insights into rejection trends and root causes, this analytics enables manufacturers to take targeted actions such as improving machine maintenance, refining operator training, or adjusting processes. This data-driven approach reduces waste, improves product quality, and boosts productivity, transforming how manufacturers manage and prevent part rejections.
The Limits and Difficulties of Manual Rejection Analysis
Even though manual rejection analysis has been used on the shop floor for a long time, it has grown less and less effective in modern, data-driven manufacturing settings. Although it might provide fundamental insights, its accuracy, repeatability, and impact are limited by a number of inherent flaws.
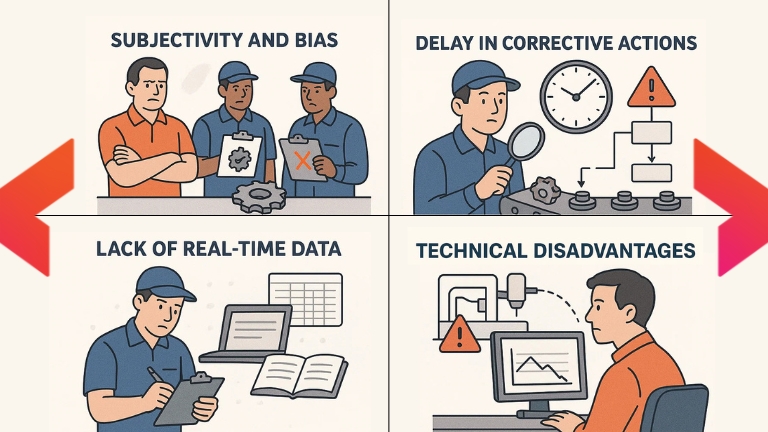
- Challenges with Manual Inspection: Manual rejection methods sometimes rely on the judgement of supervisors or operators, leading to subjectivity and bias. The same defect can be labelled differently by different inspectors, resulting in unequal rejection categories across shopfloors or shifts. In addition, the time lag between defect identification and root cause analysis lowers the rate at which corrective actions may be executed, frequently allowing the problem to persist for longer than necessary.
- Technical Disadvantages: Also, manual systems do not collect real-time production data, which is critical for finding patterns over time, equipment, and materials. These approaches rely heavily on operator memory, handwritten logs, or spreadsheets, making them error-prone and lacking in information. As a result, there is little to no closed-loop feedback in the design or production process, limiting meaningful process improvement or learning.
These risks may become worse over time in high-mix, high-precision manufacturing setups, making it impossible to identify recurring rejection issues or put systemic solutions in place. This highlights the necessity of automated, traceable, and digital rejection analytics that are connected with the production line the entire time. In contrast, solutions such as Leanworx that allows for automated logging of rejections, process variations, and machine conditions. This change from manual to data-driven quality analysis delivers the level of detail and speed needed for precise root cause diagnosis.
Conclusion
A combined focus on operator skill, process stability, and tooling accuracy is necessary to break the rejection cycle. Every pillar directly affects part quality, and performance suffers when any one is neglected. Manufacturers can transition from reactive to predictive quality control through the implementation of data-driven tools such as Pareto analysis and machine monitoring systems. The way forward is to create a feedback-driven ecosystem in which shop floor insights continuously enhance procedures, reduce variability, and result in quantifiable reductions in scrap and rework across all activities.
Increase your profits automatically. Use Leanworx to get accurate and instant data 24/7.