- How to calculate utilization of a machine [The Easy Way]

Dasarathi G V
Director in Leanworx
Dasarathi has extensive experience in CNC programming, tooling, and managing shop floors. His expertise extends to the architecture, testing, and support of CAD/CAM, DNC, and Industry 4.0 systems.
Try Leanworx for free
How to calculate utilization of a machine ?
The question ‘How to calculate utilization of a machine ’ can only be answered by first defining what is machine utilization or capacity utilization. Unfortunately, this is not a precise term and there are multiple definitions for it.
- Ratio of operating time of machine to the scheduled run time.
- Ratio of operating time of machine to total available time.
- Ratio of good parts made to good parts that could have been made in the scheduled time.
- Ratio of good parts made to good parts that could have been made in the total time.
The problem with all of these definitions is that they all lack precision, are open to a variety of interpretations, and can result in numbers that make no sense.
Example: What if a machine is running 24 in a day and all its production is rejected ? Is its utilization 100% or 0% ?
What you’ll Learn :
What is machine utilization ?
Since there are a variety of definitions of machine utilization floating out there, it makes sense to define it logically as this:
What percentage of time was the machine utilized to produce parts that can be sold ?
What is the total available time ?
If you get a loan from the bank to buy the machine, you need to repay the principal + interest on the loan every month.
They do not care how many hours I run the machine. If you run the machine only 12 hours a day, your revenue is half what it could have been if you ran it 24 hours a day.
If orders are not a constraint, it makes sense for you to run the machine longer – run it 24 hours, run it across breaks, etc. So the total available time is 24 hrs, 365 days a year.
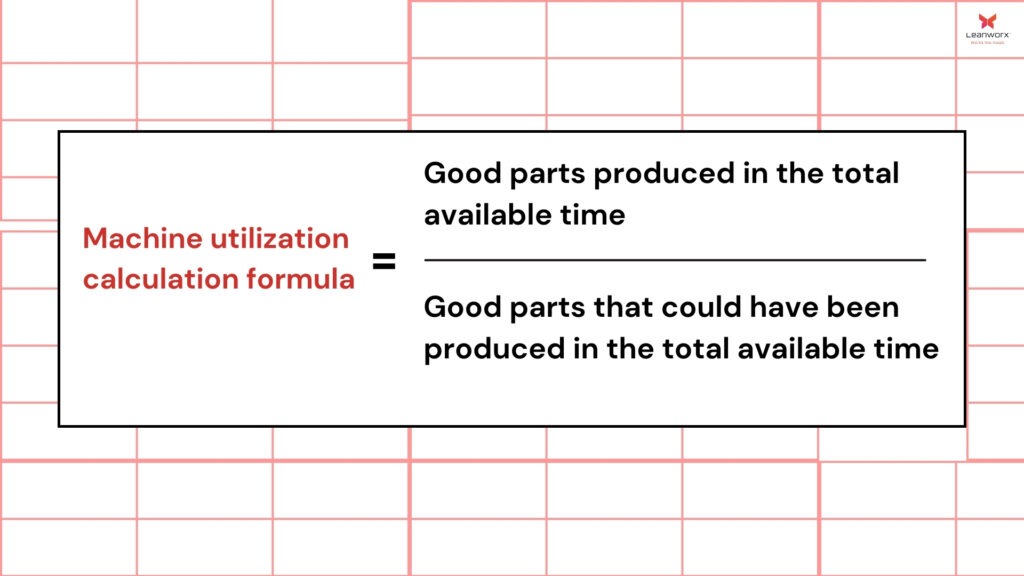
Machine utilization calculation formula
By the above definition, Utilization = (Good parts produced in the total available time / Good parts that could have been produced in the total available time ).
There is a seldom-used and relatively unknown term called TEEP that measures exactly this. It is a close cousin of OEE.
Since TEEP is a term with a clear definition and formula for calculation, we should be using the term TEEP instead of Utilization.
What is TEEP ?
Capacity utilization losses can be categorized as Equipment losses and Schedule losses.
Equipment losses are the losses in the time that a machine is scheduled to run.
This is measured by OEE.
Schedule losses are the time that the machine was not scheduled to run, but was available to run.
E.g., lunch and tea breaks, non-working shifts, holidays, no orders. It includes the whole calendar time, 24 hours, 365 days a year.
TEEP takes into account both equipment losses AND schedule losses, ie. OEE AND Utilization.
OEE is how effectively you have used the scheduled production time.
TEEP is how effectively you have used the whole calendar time.
TEEP calculation
Example 1
A machine’s OEE is 60 %. Its planned working hours are 24 hours a day without a break, 6 days a week.
Planned working hours = 24 x 6 = 144 hrs.
Total calendar working hours = 24 x 7 = 168 hrs.
TEEP = OEE x (144/168) = 51.4 %
Example 2
A machine’s OEE is 60 %.
Its planned working hours are: 6 days a week, 12 hours a day, with total breaks of 1 hour per day.
Planned working hours = 11 x 6 = 66 hrs.
Total calendar working hours = 24 x 7 = 168 hrs.
TEEP = OEE x (66/168) = 23.6 %
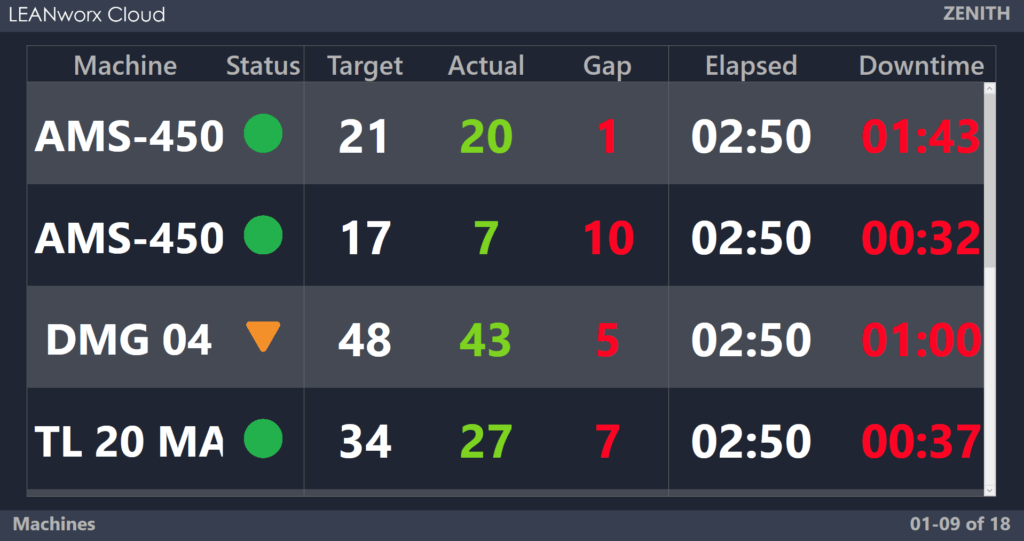
Measuring machine utilization automatically
With production monitoring via an Industry 4.0 based machine monitoring system, data flow is instantaneous, accurate, 24/7.
This is how the production monitoring works:
- There is a machine
- There is a sensor on the machine that collects data from it
- The sensor sends the data to the internet
- Cloud software collects the data and analyzes it
- Data is displayed to people, sent to other software, sent back to the same machine, or to other machines.
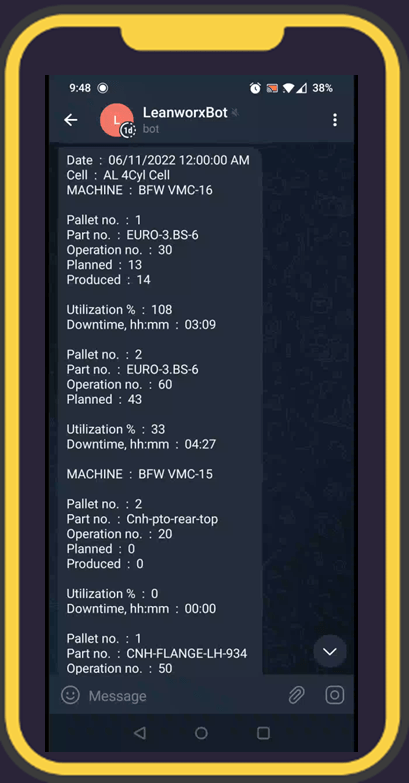
The data is collected automatically, analyzed immediately by software, and available as reports within seconds. You also get alerts on your mobile phone or email when something happens that requires immediate attention.
So here is what an Industry 4.0 based production monitoring system does for you:
With Industry 4.0, instant, accurate data is direct from machines.
With the traditional paper method, inaccurate data after 24 hours.
Start using Leanworx for free
We provide a 5-day free demo, with assistance in installation and usage.
How to improve machine utilization rapidly ?
Step 1: Reduce the downtime.
Step 2: Improve the quality – reduce rejections.
Step 1: Divide total downtime into low and high hanging fruit.
Low hanging fruit
Low hanging fruit can be fixed easily and rapidly, in just a few weeks. This is downtime caused by work ethics issues like production starting late and stopping early in each shift, extended break times, and machine idle for no specific reason.
This typically is 20 to 30 % of the total downtime. Typically, production may start 30 minutes late at the start of the shift, stop 30 minutes early at the end of the shift.
The operator may take random breaks, and meal and tea times may extend 15 minutes beyond the allotted time.
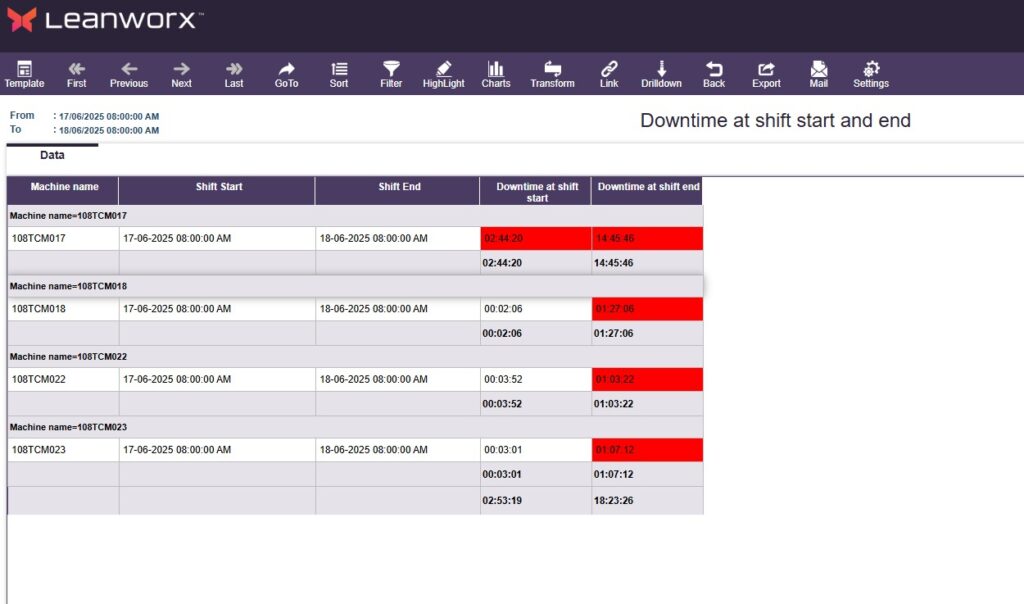
Leanworx has a standard report that shows downtime at shift change, and a report that shows production in every hour with poor production hours highlighted.
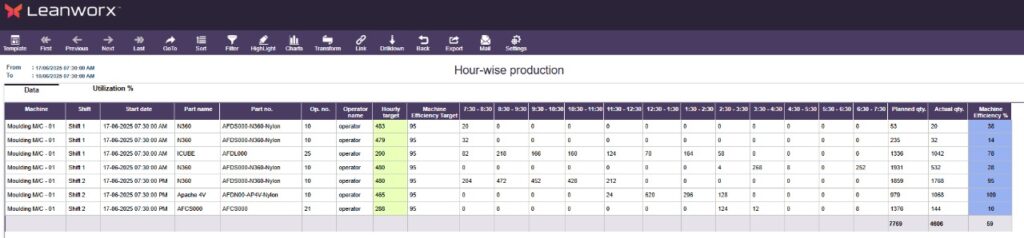
All you need to do is to put these reports up on the shop notice board, for the previous day. Poor work ethics of individual operators gets known to everyone, there is psychological pressure, and the problem stops in a couple of weeks.
This leads to an improvement in machine utilization of 10 to 15 %.
High hanging fruit
High hanging fruit is downtime due to management issues like machine breakdown, high setup times, no raw material, high inspection time, etc. These are caused by system issues, and are not in control of the operator.
Key issues are:
High part unload-load time
- Machine breakdown
- No raw material
- High setup times
- High inspection time
Downtime due to high part unload and load times
This happens when the time to unload a completed part and load new raw material is more than the standard time assigned. E.g., standard time is 30 seconds, but time taken is 1 minute. Possible causes of this issue are operator has low skill, operator fatigue, etc.
The problem can be fixed by training to improve operator skills and providing material handling aids to reduce fatigue.
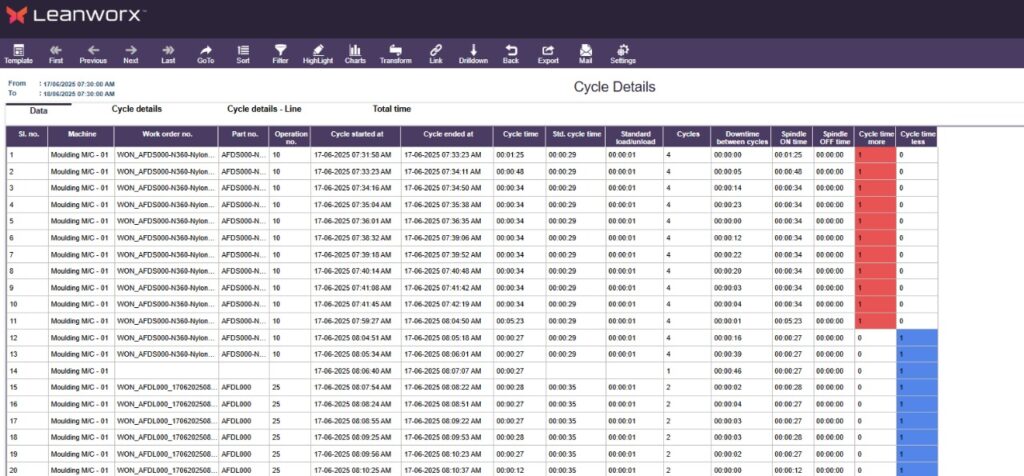
Leanworx software has reports of cycle times and load-unload times of individual cycles. You can identify issues and fix high load-unload times using them.
Downtime due to high setup times
The actual setup time can be more than the standard time allotted for setup changes.
This could be due to poor operator skills, fixture maintenance issues, or bad fixture design.
The solutions are operator training, better fixture design, auto work offset probe on CNCs, modular tooling, etc.
Leanworx has reports showing setup times for each part change. You can use these to focus on long or erratic setup times, analyze them and reduce them.
Downtime due to machine breakdowns
This can be caused by taking a long time to respond to breakdowns, frequent breakdowns, and a long time to fix breakdowns.
Leanworx has a host of maintenance features to reduce the downtime: Autonomous maintenance, preventive maintenance (time-based and usage-based), and breakdown maintenance.
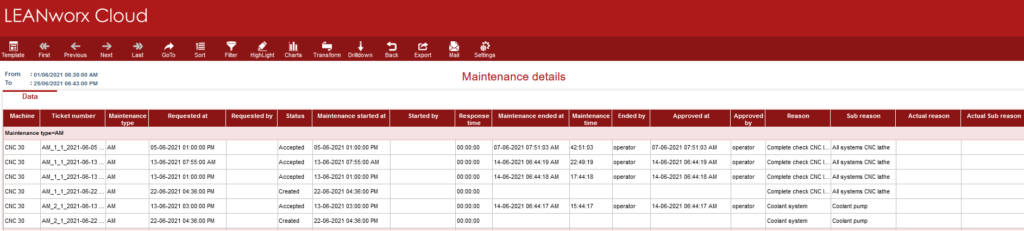
Maintenance tickets are created automatically. Maintenance personnel get breakdown alerts on mobile phones.
There are a variety of reports and alerts. You can track trends of maintenance KPIs (Mean time to repair, Mean time between failures, Mean time to attend).
Waste due to part rejection
Part rejections cause loss of raw material and of processing time. Both these cost money.
Processing time is not just the time on the machine where the rejection occurred, but also the machines in preceding operations.
Rejections may be because of poor operator skills, low process capability of the machine, etc.
Leanworx reports will tell you the rejection quantity, rejection reasons, machine operator, etc. You can pinpoint the issues, determine their cases and eliminate them.
What is a good machine utilization rate?
The typical OEE is 40 to 50% in High Mix Low Volume (HMLV) production, and 60 to 70 % in mass production. It should ideally be 25% more in both these cases.
The average machine works 132 hours, assuming 22 hrs. working per day, 6 days a week.
The total calendar time available per week is 168.
TEEP, which is the actual machine utilization, will therefore be 78% (132/168) of OEE.
Keep Learning

Increase your profits automatically. Use Leanworx to get accurate and instant data 24/7.