Benefits of Production monitoring software on profits
- Mar 19, 2024
Category : Production monitoring systems

Dasarathi G V
Director in Leanworx
Dasarathi has extensive experience in CNC programming, tooling, and managing shop floors. His expertise extends to the architecture, testing, and support of CAD/CAM, DNC, and Industry 4.0 systems.
- Production monitoring software on Industry 4.0 can improve your shop floor profits dramatically.
- You can starting results in just a couple of weeks.
- Here is an explanation of what it can do for your organization, in various areas.
Data speed with production monitoring system software
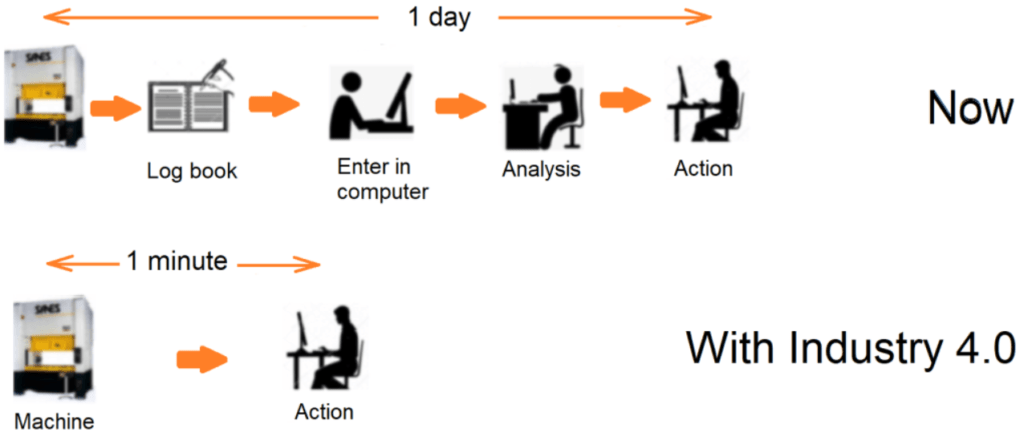
In the traditional paper-based method with a chain of people, data from machines takes 24 to 30 hours to reach decision makers. It is also inaccurate because it depends on human memory and is cooked up along the way.
With production monitoring system software based on Industry 4.0, data from machines takes less than a minute to reach decision makers.
Manual production monitoring platform - the problems
The traditional production monitoring platform consists of a chain of humans and paper. There are people who go to every machine at the end of each shift, get the numbers for production quantity, downtimes and rejections, and note them in a register. They then enter the numbers in a computer, typically in an ERP software. The night shift of each day ends the next morning, so yesterday’s data is entered today morning, a little while after the night shift ends. There is a second set of people who analyze the data, make tabular reports and charts from them, and giving the reports to senior management. Decision makers use these reports in the daily production meeting, to review the previous day’s performance.
Decision makers in the company get the data from manual machine monitoring, via a human data chain and paper registers. The operator, supervisor and manager cook up the data to hide bad performance. Decision makers get the data after more than 24 hours. The data is not accurate, and arrives too late to take action if there are crisis situations. The morning production meeting is only a review of the previous day’s cooked up data, and therefore quite useless.
Real-time production monitoring software - how does it solve the problems ?
In a real-time production monitoring software based on Industry 4.0, data is collected automatically from machines, sent to software automatically, analyzed immediately by software, and available to decision makers as reports within seconds. Decision makers also get alerts on their mobile phone or email in crisis situations that require immediate attention. The data goes automatically to ERP and any other software that needs it.
People do not collect data from machines and enter it in your organization’s computers. The machine monitoring software and hardware do this automatically.
So there is no way to alter data, and data is available in seconds. There is no manual data collection and entry, and no manual generation of reports. A variety of reports are generated on production quantity, OEE, quality, maintenance, operator efficiency, consumables usage, and energy consumption. Data availability to decision makers: With an Industry 4.0 based machine monitoring system: 1 minute. With manual machine monitoring: 1 day, or 1440 minutes.
Production quantity accuracy - effect of manufacturing monitoring software
Production quantity is tracked automatically from the machine, and available as a variety of reports: hourly production, shift-wise and day-wise production, details of individual cycle times, planned vs. Actual production, production quantity trends. Production supervisors and managers get an alert on their mobile phone or email when there is a target shortfall in a shift. Andon boards in individual sections of shop floors show operators the current production and target in the shift.
Example of benefit of production tracking by machine monitoring system: Leanworx manufacturing monitoring software is connected to 45 machines in an automobile parts manufacturer. All are presses and other metal forming machines. Part cycles times vary from 3 seconds to 20 seconds, which means 1300 to 9000 parts are produced in each shift on each machine. There was no accurate production tracking. This resulted in: over-production causing excess inventory and increase in inventory holding cost; under-production causing delivery delays; inability to schedule properly. Leanworx machine monitoring system counts the actual number of parts made, at any instant. Reports show hourly and shift-wise production. Over-production and under-production have been eliminated, leading to lower inventory costs, better scheduling, improvement in profitability.
OEE monitoring - improvement with real time production monitoring software
OEE is a measure of the capacity utilization of your machines. Essentially, how many good parts they produce for you versus how many they could have produced. To improve OEE you need to reduce waste in your shop floor, in the form of machine downtime and part rejections. Lean manufacturing, or LEAN, is the systematic elimination of waste (‘Muda’) within a manufacturing system.
Leanworx real time production monitoring has a variety of OEE reports based on machine monitoring data:
- - Dashboards showing the current shift OEE, production, downtime
- - Andon board on large LED displays on the shop floor showing the shift OEE, production, downtime.
- - OEE reports shift-wise, day-wise, week-wise, etc., with Availability, Performance and Quality, and the breakup of the calculation for arriving at the values.
- - Long term OEE trends monthwise, quarter-wise etc.
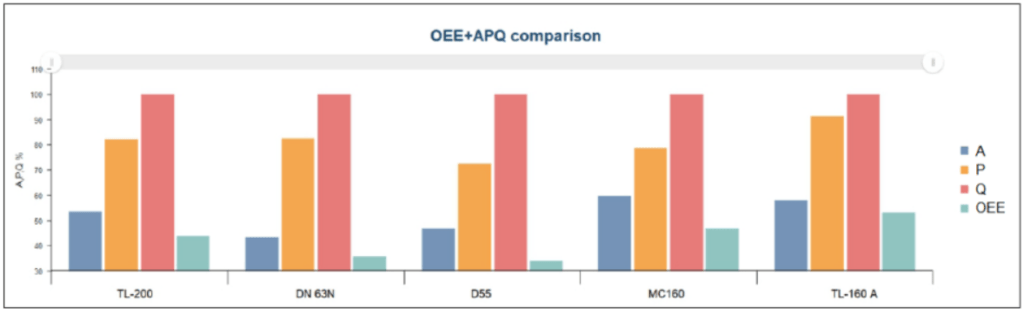
- - Comparison of OEE between multiple machines and colleciton of machines - cell, shop, plant.
Example of benefit OEE tracking by machine monitoring software: Leanworx is connected to 72 machines in an automobile parts manufacturing plant. The machines are CNC VMCs, HMCs, lathes, and foundry machines – sand moulding, core shooters, fettling. The machine hour rate is Rs. 350 on average. When Leanworx was installed for machine downtime monitoring, the OEE varied from 32 % to 65 % for various machines, with CNC machines being at the lower end. After Leanworx was installed, in 5 months the OEE improved by 23 % on CNC machines and 15 % on machines in the foundry. The end result was higher profits. The same number of machines are producing more.
Downtime monitoring - effect on speed and accuracy
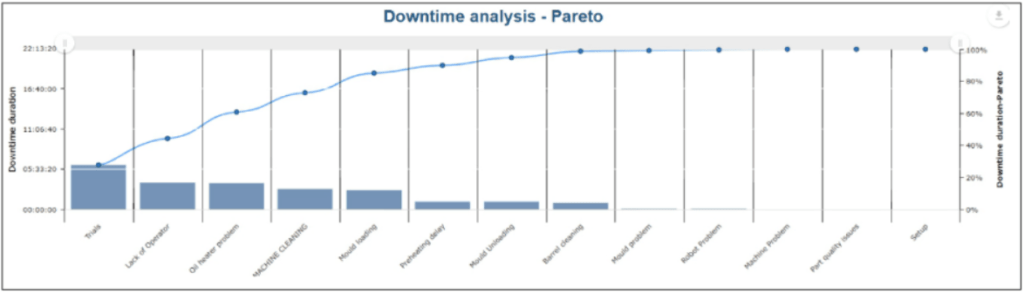
Leanworx’s machine downtime monitoring feature automatically detects machine downtime durations. Machine downtime monitoring is done continuously, and durations are automatically recorded. Machine downtime reasons can be recorded automatically or via devices that are part of the downtime monitoring system. There are a variety of reports and alerts that help you reduce the waste.
The downtime monitoring software shows reports like machine downtime details (the start and end time, duration and reason) of individual downtimes, machine downtime analysis report as Pareto and Pie charts, downtimes at shift change, and machine downtime trends over time – day-wise, a down week-wise, month-wise, etc. It sends alerts on the mobile phone or email to shop supervisors and managers if there an abnormal downtime, or if there is a downtime due to a specific reason. It escalates the alerts to higher level decision makers if a downtime is not fixed.
Machine downtime reduction becomes easy if you have machine monitoring software with all these features. You can do machine downtime analysis regularly, and eliminate the big downtime reasons systematically. You can also reduce machine downtime caused by crises situations like breakdowns, using the alerts.
Example of benefit of machine downtime monitoring
An automobile parts manufacturer uses Leanworx machine monitoring system with 39 CNC machines, mainly for reducing machine downtime. The machines are CNC lathes, VMCs, HMCs. The plant works 3 shifts: 6 AM-2PM, 2PM-10PM, 10PM-6AM. The average machine hour rate is Rs. 500.
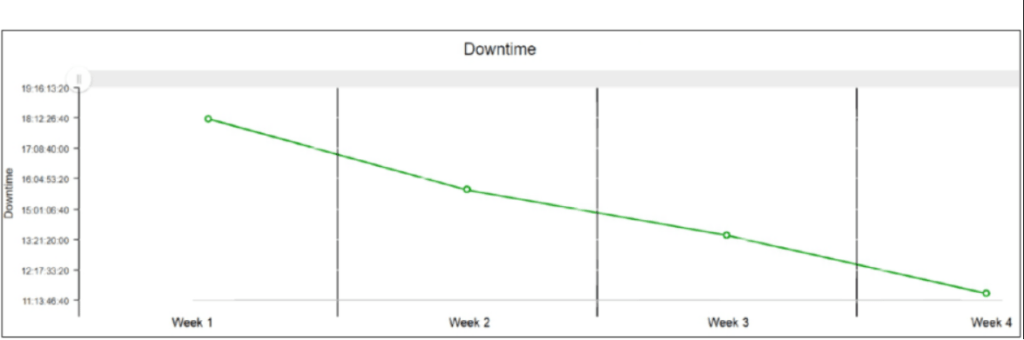
Before Leanworx was installed to reduce machine downtime, machine monitoring was done manually and the data recorded on paper. In every shift the production started late and ended early. Highest downtimes were at the end of the 2nd shift, and start and end of the 3rd shift. Average downtime was 1 hour per shift, reducing production capacity by 12%.
After the CNC machine monitoring was started, the downtime dropped by 25 % on its own, without any action, just 2 days after Leanworx was connected to all machines. In 3 weeks the downtime reduced to less than 5 minutes per shift. Production quantities increased proportionately, by 12 %. Nobody actually took any action to reduce machine downtime. It was a works ethics issue, and resolved itself when operators knew that machine monitoring software was generating accurate and instantaneous data.
Quality monitoring - with real-time production monitoring software
Leanworx can track part dimensions values and rejections. Rejection quantities and reasons can be tracked automatically from signals from the machine or inspection device, or from operator input devices. It can generate reports of rejection details (showing each instance of a rejection), inspection data, rejection reasons analysis Pareto and pie charts, and rejection trends over days, weeks, months, etc. These features enable you to focus on the big causes of rejections and fix the issues causing them. These could be machine problems, process problems, raw material issues or operator skill level.
Example of quality monitoring using Leanworx machine monitoring system:
Leanworx is connected to induction hardening machines in the shop floor of a large automobile parts manufacturer. Parts are accepted or rejected based on the amount of energy used for the hardening. A handful of parts are rejected every shift, but the segregation of these is extremely strict. Even if one rejected part is put in the accepted bin, the consequences are disastrous. If it fails in the field, vehicles with all the parts made in that batch must be recalled for a replacement, and the part manufacturer must pay a big penalty.
Leanworx tracks the energy consumption for every part. If the energy is beyond a pre-specified band, it marks the part as rejected. An alert is sent to the supervisor’s mobile phone and email. He comes to the machine and ensures that the part is put in the rejected bin. Leanworx shows a cycle details report with every single part – start and end time of the cycle, energy level, whether OK or rejected. This helps with later auditing. The system has made a very big difference to the quality, and to Leanworx user’s vendor rating in the customer’s procurement system.
Energy monitoring - done by machine monitoring system
Leanworx has energy monitoring features that track machine-wise energy consumption. It shows reports of energy consumption of each machine hourly, daily, weekly, etc. It also shows long term trends of consumption. Here is how you can use these features to cut energy cost.
Power off machines that are idle
Machines in shop floors are usually powered on even though they are idle for long periods of time. E.g., when there is a whole shift or day with no planned production, or when there is no raw material because a previous process has a breakdown. Even though a machine is not producing parts, its various systems are consuming power – the controller, coolant system, chip conveyor, lube system, etc. Depending on the type of machine, the power consumption when idling may be 25% to 75% of the consumption when producing parts. It makes sense to power the machine off during this time. Energy monitoring via a machine monitoring system can alert shop floor personnel to these idle periods so they can remember to power off machines.
Identify high energy consuming machines
The energy consumption of a machine depends a lot on its build quality and age. The quality of its motors, bearings, friction in moving parts, heating elements, etc. decide the efficiency with which it converts electrical to mechanical energy. With energy monitoring as part of the machine monitoring software, if you track the power consumption of different machines making the same part, you might find that some machines are sucking up much higher energy per part because they are old or are of poor build quality. This directly affects your power bill and the cost per part. You can identify such machine with poor energy efficiency and improve their quality, decide to use them less, or even replace them with better machines.
Operate machines during off-peak hours
Your utility company may have a Time of Day (ToD) Tariff system, with different tariffs for different times of the day. You may get a discount on power consumed at certain times of the day, like ‘Happy hours’ in a pub. This is done to prevent overloading of the utility system, or to make you shift to hours that have cheaper power production. For example, during daylight hours (‘solar hours’), there is power generation from solar power, which is cheaper and more environmental-friendly. During non-solar hours, power generation is wholly from thermal, gas-based and hydro power. All these are more expensive than solar power. So your utility company may offer a tariff concession during Solar hours to encourage people to consume more power during solar hours.
Machine monitoring enables you track the energy consumption for each machine hourly, daily, weekly, etc. It also shows long term trends across months or quarters. To get these reports, you just need to connect an energy meter on every machine, and connect the meters to Leanworx.
Leanworx tracks energy consumption in two ways:
- 1. Electrical energy consumption of individual machines.
- 2. Fuel consumption in furnaces and gensets, like diesel or LPG.
Example of benefit of energy monitoring by machine monitoring system: Leanworx is connected to all machines in a shop with CNC machines. Machines run 3 8-hour shifts, but do not work from 4 AM to 7 AM because operator productivity was found
to be poorest at this time. The machines were not powered off at 4 AM, and the mornng shift operator came at 7 AM and started working. The plant head saw the hourly trend of energy consumption on machines in Leanworx, and wondered why there should be any energy use at between 4 AM and 7 AM when the machines were idle. Operators were instructed to power off machines when leaving at the end of the 3rd shift. This resulted in a big saving in energy bills and part production cost.
Consumables monitoring - what can machine monitoring track ?
Leanworx has a consumable consumption monitoring feature that track machine-wise consumables consumption. It shows reports like these:
- - Consumables change details - what consumable was changed, date and time of change, quantity changed, who changed it, etc.
- - Consumables usage analysis that shows the consumption of each consumable or type of consumable as Pareto and pie charts. This enables you to focus on the big consumption items and reduce their usage.
Leanworx can track the consumption of discrete as well as continuous flow consumables. Discrete: Changing inserts and tools on CNC machines, changing the coolant, changing lube oil on a press, etc. These are done occasionally, whenever needed. Continuous flow: LPG in a gas-fired furnace, inert gas consumption in soldering and welding, welding wire on a welding robot, etc.
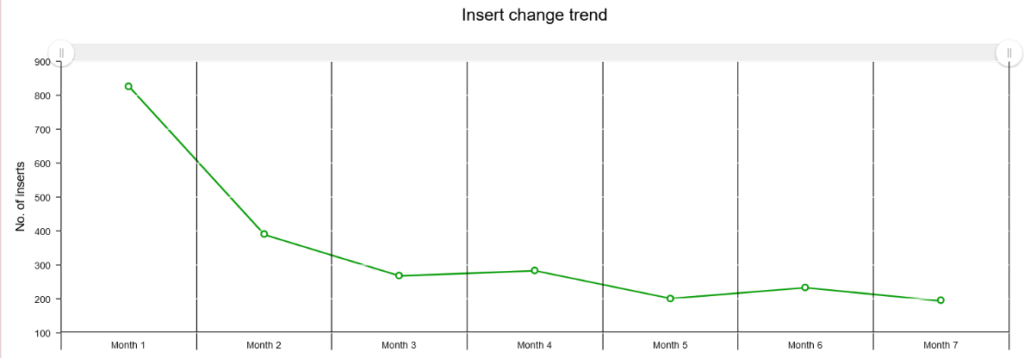
Example of benefit from consumables tracking: Leanworx is connected to CNC machines in a job shop making parts for off-road vehicles. In just 1 month after starting the monitoring of cutting inserts, they managed to cut consumption by 52 %. 5 months later, it further dropped to 76% of the earlier consumption. This is a big saving, because cutting tools and inserts are expensive, and can account for between 3 to 7 % of the total operational expenditure. This saving was many times what they are paying for the machine monitoring system.
Operator performance - BIG effect of machine monitoring system
Leanworx has operator efficiency reports that show performance of each operator in terms of production, productivity, downtime and rejections. There are features like:
– Operator check in/checkout
– Advance scheduling of operators to machines and shifts
– Unique operator login ID and password
– Matching of operator skill type and skill level with machine type
– Rejections and consumables consumption (inserts, tools, welding wire, etc.) by each operator
– Shift-wise operator efficiency details
that enable tracking of which operator worked on which machine, in which shift, etc.
The reports can be used in the following ways to improve productivity and reduce operator attrition:
– Identify skill gaps and train operator in the gap areas.
– Pay incentives for good performance, to encourage and motivate good performing operators.
Example of benefit from machine monitoring system: Leanworx is connected to 130 machines in an automobile parts manufacturing firm, all CNC lathes and machining centers. The average machine hour rate is Rs. 350. Operators were being paid fixed salaries with no production or productivity-linked incentives. Efficient operators felt unrewarded since they were getting the same as bad operators with poor skill or motivation. After Leanworx was installed for machine monitoring, an incentive scheme was put in place with data coming from the operator efficiency reports. OEE improved by 19 % in 3 months. Operator attrition reduced by 42 % in 3 months, and good operators stayed. Skill levels were gauged based on rejection rates, time taken for setup, etc. A continuous training scheme was introduced to fix skill gaps. Savings: Rs. 38,000 per machine per month.
Maintenance monitoring - HUGE improvement
Leanworx machine monitoring system has maintenance monitoring features that can dramatically improve efficiency of your maintenance, reduce machine downtime and cut cost of spares. This applies to both breakdown maintenance, and preventive maintenance. Leanworx has maintenance monitoring features for all types of maintenance:
- - Breakdown or unscheduled maintenance (UM): Automatic ticket creation, ticket opening and closing by the maintenance technician, acceptance of repair by the operator. Maintenance personnel get alerts on mobile phone or email when there is a breakdown.
- - Time based preventive maintenance (TBM):
Breakdown maintenance or Unscheduled Maintenance (UM)
When a machine breaks down on the shop floor, this is what happens: The operator searches around for the supervisor and reports the problem after he finds him. The supervisor then searches for the appropriate person in the maintenance department and reports the issue – the Time To Report. The maintenance technician then arrives at the machine after some time – the Time To Attend. The technician repairs the machine and gets it running again after some time – the Time to Repair.
In Leanworx, the machine monitoring system captures key parameters to show you reports that help you reduce the machine downtime caused by breakdowns. You get reports of trends of MTBF (Mean time between failures), MTTA (Mean time to attend), MTTR (Mean time to repair).
You can use these numbers to reduce downtime by asking these questions: Is MTTA high because you have too few technicians and they are always busy attending to some other machines ? Is it a culture issue – do technicians not go promptly to a machine when a problem is reported ? Is the MTTR high because technicians lack skill, and need to be trained ? Do you do not have enough commonly used parts in stock ? Is it because of an equipment issue – no proper equipment for diagnosis and repair ? Is the MTBF low because of misuse by operators ? Do they need training ? Or is it because of the machine’s age ? Do you need to replace it with a newer machine ? Is it because the quality of spares used is poor, or the repairing is incomplete because technicians lack skill ?
The maintenance features in Leanworx machine monitoring system can give you accurate and timely data on all these so that you can reduce downtime due to breakdowns.
Preventive maintenance – time based (TBM)
A machine breakdown has a direct cost and may have numerous indirect costs. The machine downtime of course costs money and lost production. There are also indirect costs, like a bearing failure could result in damage to other related parts. Preventive maintenance is cheaper because you can do the maintenance at a time when the machine is going to be idle, like on a weekly off day or in a non-working shift.
In Time Based preventive maintenance (TBM) we replace a part after it has been used for a certain number of hours. In Leanworx machine monitoring system, you can schedule preventive maintenance tasks in advance. Each maintenance task can be Autonomous Maintenance (done by the machine operator) or done by the maintenance department. The operator or maintenance person are prompted before the task is due, on the maintenance screen, mobile phone or email. Ticket creation and handling is just like in UBM.
Preventive maintenance – usage based (UBM)
In TBM, we do the maintenance after a certain time period, irrespective of the actual amount of time that it has been used. This may involve just time for the maintenance, or time and parts replacement. What if the machine did not actually run for much of this duration because there was no load (no orders) ? We spend time or replace parts anyway, even though it has not been used much. We do this because we have no way of keeping track of the actual number of hours that the machine has run. This is wasteful.
You need a machine monitoring system to track usage of machine parts 24/7, and this is what Leanworx does. You can switch from time based preventive maintenance to usage based preventive maintenance.
In UBM, maintenance is based on how much time the machine or a machine sub-system has actually run, instead of on calendar time. E.g., you would change a part in the pallet in a CNC HMC after a pre-decided number of parts are made. This of course is possible only with a machine monitoring system running 24/7. Leanworx can track the actual running time of the machine, show reports of the actual run time of each critical part since its last replacement, and generate an alert when maintenance needs to be done. UBM schedules can be based on the number of hours run, number of parts made, machine spindle rotation time, etc. Preventive maintenance cost is reduced because you do when it is actually required. You cut costs by using parts for longer durations based on actual usage and not prematurely replacing them based on calendar time. More on Preventive Maintenance here.
Condition based maintenance (CBM)
Maintenance must actually be done only when the condition of a machine sub-system or part requires it. This we can know only based based on measured physical parameters. E.g., change a bearing only when the vibration level exceeds a pre-determined value.
In TBM and UBM we do not actually know that maintenance is actually required. We replace parts before their life is actually over just to be on the safe side and to prevent breakdowns. For example, a part could have as much as 30 % life left when we replace it. This means we have recovered only 70% of the cost of the part. This is where CBM can cut the cost. The machine monitoring system continuously monitors the condition of the part, by checking key parameters like vibration level, temperature, etc. If the parameter goes beyond a certain limit, the software concludes that the part needs to be replaced. This of course requires analysis of past data and knowledge of actually failures in the past. Leanworx tracks the condition of the machine part (or sub-system) through sensors, and generates an alert when the parameter being tracked goes beyond a pre-set value.
Summary - BIG improvement because of machine monitoring system
Leanworx machine monitoring system has a variety of features that enables you to do all these, to improve productivity and profits dramatically, in just months:
- Production monitoring
- Downtime monitoring
- Productivity (OEE) monitoring
- Quality monitoring
- Energy monitoring
- Consumables usage monitoring
- Maintenance monitoring
- Operator efficiency monitoring
Increase your profits automatically. Use Leanworx to get accurate and instant data 24/7.