5 Production Efficiency Examples That Could Save You Millions
- May 24, 2025

Dasarathi G V
Director in Leanworx
Dasarathi has extensive experience in CNC programming, tooling, and managing shop floors. His expertise extends to the architecture, testing, and support of CAD/CAM, DNC, and Industry 4.0 systems.
5 Production Efficiency Examples That Could Save You Millions
- The production inefficiency on Indian shop floors is not just about skills.
- It’s a complicated mix of outdated procedures, overlooked process controls, insufficient new technology and system
integration, and a heavy reliance on human interaction when automation should have replaced it years ago. - Even though the Indian manufacturing sector’s size and capabilities are growing, reactive maintenance, manual setups, paper-based reporting, and underutilised CNC assets still account for a large portion of shop floor reality.
- The result? Machines operating at only 50-60% of their true capability, cycle times that might be 30% shorter, and rejection rates that are implicitly tolerated as “process losses”.
- These inefficiencies are not hypothetical; they occur on a daily basis in a various types of industries, including precision aerospace machining and automobile parts. In this blog, we examine five real-world production efficiency examples and their relative concerns, not as abstract theories, but as technical pictures from genuine Indian shop floors.
- Every case is based on real-life shop floor difficulties and points out the primary barriers to higher productivity, consistent quality, and more efficient operations.
What is Production Efficiency?
Production efficiency is a manufacturing process’s ability to produce the maximum number of good and consistent parts with the least amount of time, resources, and effort while maintaining quality standards.
Key elements that dictate the production efficiency of a manufacturer or a shop floor.
- High machine utilization (less idle time)
- Low rejection/rework rate
- Minimal setup and tool change time
- Consistent quality without delays
- Right part, right time, right way every time
It might sound very basic to most of you, but the basics of production efficiency things like reducing idle time, avoiding rework, or sticking to shift targets are where most manufacturers struggle. These aspects are not complex in concept. In fact, they are so fundamental that they’re often being overlooked.
But here’s the reality:
It takes serious technology, well-organised systems, and firm execution to solve these “simple” issues on a real shop floor.
Every “basic” issue is actually a series of more complex issues, including imprecise data, untraceable tool updates, insufficient operator accountability, and a lack of real-time visibility. To overcome each of these, much more than theory is required: interconnected systems, precise measurements, and continuous feedback loops.
Here are the top 5 most common and basic production efficiency examples
Here are five of the most common yet often overlooked production efficiency examples that can be seen on Indian shop floors, which can be easily addressed with production efficiency software (PES) for a clear increase in output, quality, and uptime.
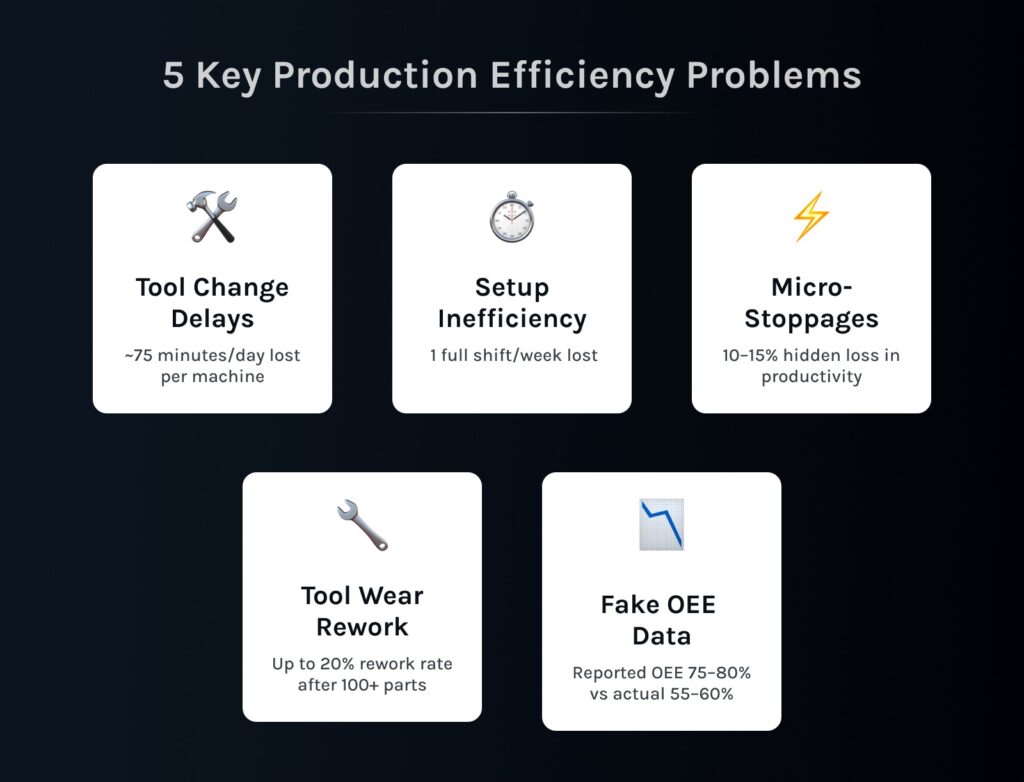
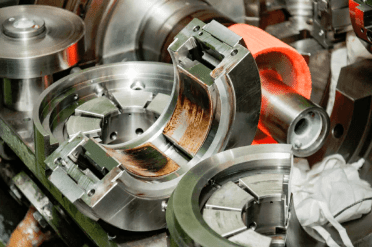
1. The 14-Minute Tool Change That Happens 6 Times a Day
Many precision machining shop floors continue to use manual tool changes without presetting systems. Every time a tool is replaced, operators stop production to manually measure offsets on the machine. Although it may appear unimportant, each machine loses more than an hour of spindle time per day when 5-6 tool changes are carried out throughout a shift, with each change taking 10-15 minutes. In addition to being a technological problem, the lack of offline presetters, tool setters, or automatic wear adjustment is a silent productivity killer.
What role can Leanworx play in improving production efficiency here?
When a machine stops and begins during tool change, software like production efficiency saves the exact timestamp. This makes it easier to calculate how much time is spent in the shop, by machine, and by each shift. Allowing you to catch the differences between productivity between shifts, batch, and machine and react upon it to bring it to the same level.
2. Setup Time That Wastes a Full Shift Every Week
Fixture changes are still a major time sink in many Indian die manufacturing facilities, particularly those that handle high-mix components. Operators sometimes spend hours manually aligning and probing each setup in the absence of modular fixture systems or defined datums. A shortage of digital setup instructions, quick-change plates, or datum memory causes
frequent delays; this is due to a lack of repeatability, not complexity. Despite having competent machinery and qualified workers, this setup inefficiency continues to hamper throughput and is frequent in small to medium-sized tooling facilities.
How does production efficiency help you with this challenge?
Setup checklists, preset values, and digital SOPs can all be directly connected to each task or part program. By verifying that operators regularly follow a consistent and well stated method, this reduces setup variation and manual errors. This gradually improves process reliability and lowers the learning curve for new or rotating operators.
3.The Invisible Micro-Stoppage Problem
Micro-stoppages silently affect productivity on many high-volume automotive component lines, yet they are often unnoticed. Minor issues such as air pressure decreases, coolant fluctuations, or irregular part loading caused machines to frequently stop for 30 seconds to 2 minutes. As they were not regularly tracked, these frequent disruptions did not appear in the daily reports. Because of this, actual productivity was far less, closer to 55%, despite the claimed OEE of over
70%. These tiny but frequent losses were undetected and neglected due to manual shift reporting and a lack of real-time data collection.
What change does a PES bring for this production efficiency example?
PES can import tool offset data directly into the system when offline presetters or in-machine tool setters are being used. When no manual entries are included, delays and input errors are ultimately reduced.
4. Rework from Tool Drift That Could’ve Been Prevented
Maintaining exact tooth profiles becomes more difficult for gear producers as tool wear increases after producing 100-120 components. Throughout the machining cycle, dimensional shifts are very common due to spindle thermal expansion, and finishing cutters gradually lose sharpness. When in-cycle probing and automatic tool wear adjustment are not used, these
elements contribute to increasing the number of rework rates and part rejections due to out-of-spec backlash. Even when machines offer spindle heat compensation functions, they are commonly underutilised, leaving an important gap that directly affects production and quality.
Here we can help you understand with a real example of Leanworx, how a production efficiency can help a gear manufacturer.
For this production efficiency example, Leanworx provides operator reports that include skills, quality, part load times, and setup times. This allows you to monitor and improve how operators handle tool settings, including tool presetting. To reduce downtime caused by machine failures, it also offers automated maintenance ticketing and detailed reports on MTTA,
MTTR, and MTBF. Also, software like Leanworx can help you in detecting and reducing delays caused by manual tool offset measurements by offering high-level analysis of downtime reasons, including detailed breakdowns of each case.
5. Inaccurate OEE – The Illusion of Efficiency
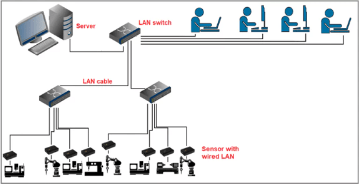
Even today operator-filled shift logs are a primary source of data for OEE calculations on many Indian shop floors. On the real side, these logs are frequently rounded off, incomplete, or edited in order to avoid pinning blame. As a result, machines that are genuinely running at 55-60% utilisation may show exaggerated OEE numbers of 75-80%. This gap is due to a lack of an IoT layer, real-time machine data collecting, and a digital system for accurately identifying downtime. As a result, significant production capacity is quietly lost while management is misled into believing efficiency levels are satisfactory.How does an OEE measure precisely with a production efficiency
Leanworx takes on this by automatically capturing real-time machine data, removing the guesswork and differences found in manual shift records. It provides detailed OEE, Availability, Performance, and Quality reports for analysing long-term productivity trends. The Andon board provides full visibility to shop floor operators and supervisors by providing real-time OEE, planned vs. actual production, and a live production count. This brings the most crucial thing missing: accountability on the shop floors. Indian manufacturers & Indian shop floors have far more capacity and capability than what’s currently being utilised. The challenge isn’t just machinery or manpower; it’s visibility. We have no idea what is wrong, and in some cases, we refuse to accept that anything is wrong on our shop floors.
Improving above mentioned production efficiency examples does not demand extremes and complexity. By using the right tools and approaches, manufacturers run their operations smoothly. With the right production efficiency software like Leanworx, manufacturers can clearly identify where time, effort, and output are being lost. Once the gaps are visible, fixing
them becomes a matter of process, not guesswork. The potential is already on the shop floor; what’s needed is the right tool to take advantage of it.
Keep Learning
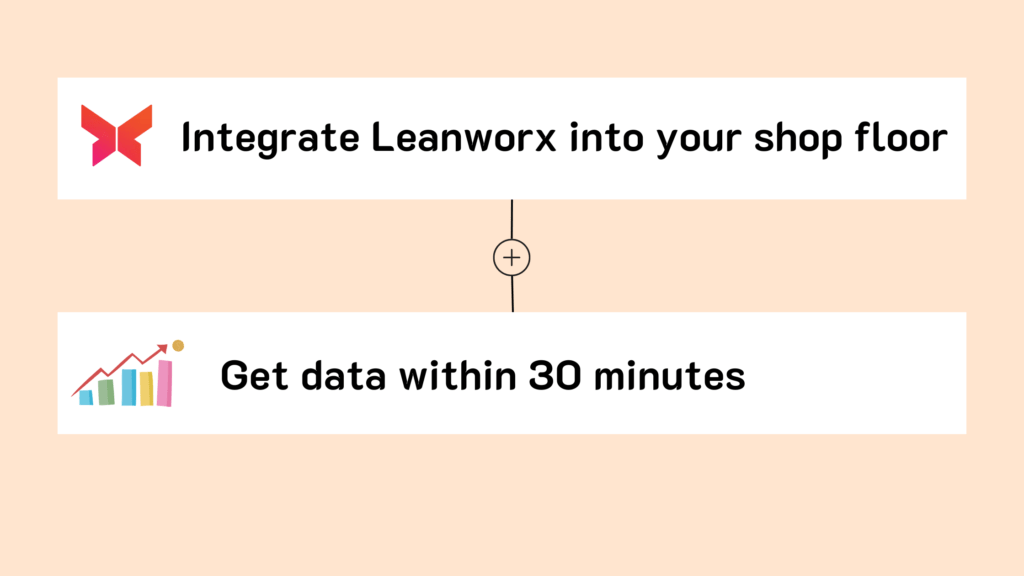
Increase your profits automatically. Use Leanworx to get accurate and instant data 24/7.